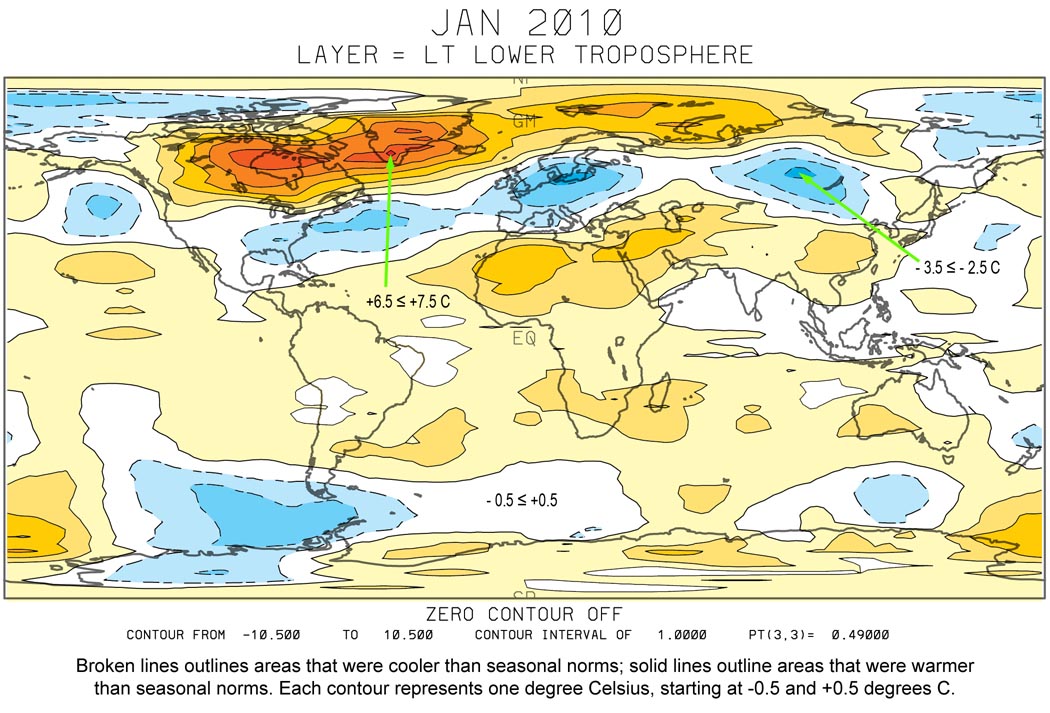
January 2010 Global Tropospheric Temperature Map
Here’s the UAH lower tropospheric temperature anomaly map for January, 2010. As can be seen, Northern Hemispheric land, on a whole, is not as cold as many of us thought (click on image for larger version). Below-normal areas were restricted to parts of Russia and China, most of Europe, and the southeastern United States. Most of Canada and Greenland were well above normal:
It should also be remembered that lower tropospheric temperature anomalies for one month over a small region are not necessarily going to look like surface temperature anomalies.
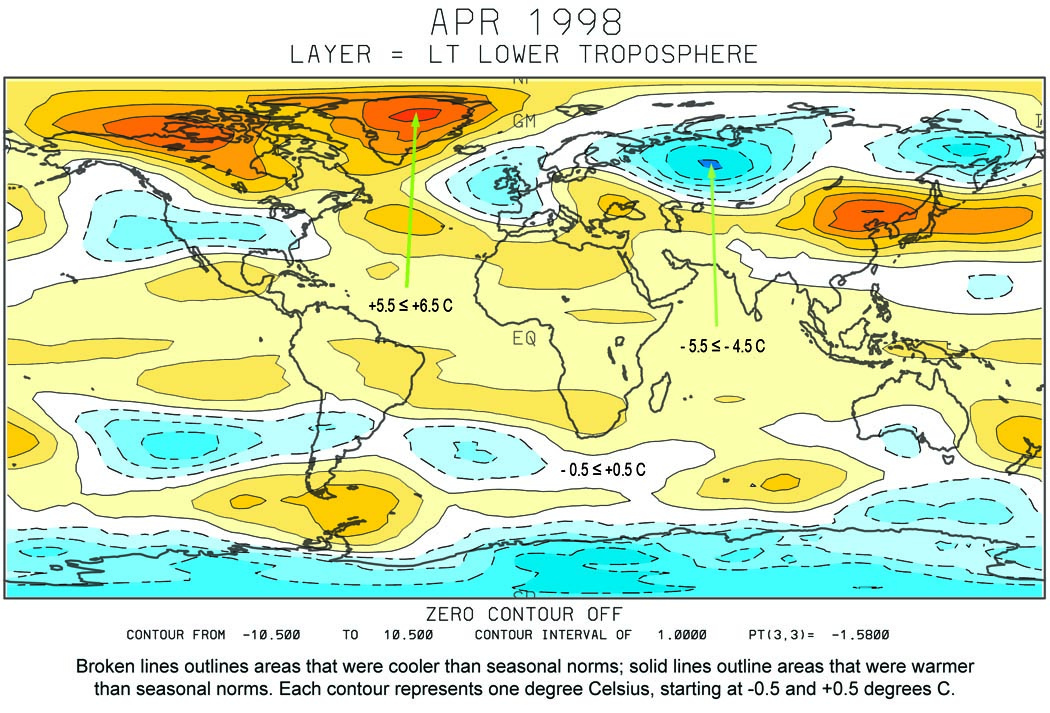
Since January 2010 was the third-warmest month in the 32-year satellite record, it might be of interest to compare the above patterns with the warmest month of record, April, 1998, which was an El Nino year, too:
(click image to enlarge)
Comments